

Some Reflections on Consensus
Motivation
In recent weeks, I’ve been trying to untangle a strange tension in the corporate strategy of many startups. Management teams often hold two vague beliefs — each reasonable — but that border on contradiction when combined:
Good things are going to happen for us because we’re small and focused.
Good things are going to happen for us in the future because we’re going to operate at massive scale and be a platform company playing in many markets.
If we want, we can pick apart each of these. It’s not too hard to attack (1); life is hard for small companies. And for (2), sure, there are many advantages to being a big company, but none of them are inevitable.
But all the same, what if the advantages conferred to small companies aren’t because they’re small per se, but because they’re relatively unencumbered by the need for consensus?
When I refer to consensus here, I mean something different than coordination. To me, coordination requires many people to contribute partially to execute some initiative, while consensus refers to some critical mass of people jointly agreeing. In large organizations, these often sound similar. Soft verbs like “socialize” or “circulate” can signal either, but in general, I’ve found consensus building much more difficult. As group sizes grow, I’ve found, the harder it becomes to make decisions.
So I began to wonder — what if the impulse to consensus is shared among small and large organizations, but only revealed and troublesome in the large ones?
Developing a Framework
I wanted to play with what it looks like for groups to make decisions by consensus. I feel it’s common for people to complain about coordination problems in groups, but it seems to me that people broadly believe consensus is desirable — I’m unconvinced.
The choices and their worth
Let’s suppose there’s some decision-making body; it’s made up of N people. This group must make exactly one selection from any of three choices, and we’ll assign each some outcome value.
A ‘correct’ choice, worth +10 points
An ‘incorrect’ choice, worth -5 points
The status quo, worth 0 points
The level of ‘obviousness’
Now, because the group is made up of people, let’s say each individual has some probability of selecting each choice, and for the sake of simplicity, just suppose they’re twice as likely to pick the status quo as the incorrect choice.
‘Correct’ choice has some probability p
‘Incorrect’ choice has probability (1/3) * (1-p)
The status quo choice has probability (2/3) * (1-p)
We can choose to interpret p as the level of obviousness. If p is high, the correct decision is pretty obvious, and an individual is therefore likely to pick it. If p is low, the correct decision is not obvious, and it’s therefore unlikely to be selected.
This is a useful time to recall a basic statement about probabilities; so long as p < 1, as N increases, the probability that N people jointly pick the ‘correct choice’ goes to zero. (Getting a large group to agree without exception — even on something very obvious — is challenging.)
Introducing the consensus threshold
Then let’s say there’s some consensus threshold — a minimum percent of the group required to make any decision other than the status quo. For the group to decide on the ‘correct’ choice (or the ‘incorrect’ choice), it must be selected by a greater share of the group than either of the other choices and that share must exceed the consensus threshold. For example, if 60% of the group selects the ‘correct’ choice, it is the most popular choice, but it can only be selected by the group if the group’s consensus threshold is less than 60%.
Here’s what that looks like in some ugly, slow R code:
draw_choice_from_individual <- function(probability_correct_choice, residual_probability_status_quo){
  prob <- sample.int(10000, 1) / 10000
  choice <- ifelse(prob < probability_correct_choice, "correct",
                   ifelse( prob < probability_correct_choice + ( 1 - probability_correct_choice) * residual_probability_status_quo, "status quo",
                           "incorrect"))
  return(choice)
}

draw_from_sample_sized_N <- function(num_individuals, consensus_threshold, probability_correct_choice, residual_probability_status_quo){
  working_vect <- rep(NA, 0)
  for(i in 1:num_individuals){
    working_vect <- append(working_vect, draw_choice_from_individual(probability_correct_choice, residual_probability_status_quo))
  }

  margin_table <- table(working_vect) / num_individuals

  val_correct <- ifelse(is.na(margin_table["correct"]), 0, margin_table["correct"])
  val_incorrect <- ifelse(is.na(margin_table["incorrect"]), 0, margin_table["incorrect"])
  val_status_quo <- 1 - (val_correct + val_incorrect)


  if(val_correct > consensus_threshold & val_correct >= max(margin_table)){
    score_to_return <- 10
  }
  else if(val_incorrect > consensus_threshold & val_incorrect >= max(margin_table)){
    score_to_return <- -5
  }
  else{
    score_to_return <- 0
  }
  return(score_to_return)
}
Modeling Some Outcomes
Now under this framework, what happens to decisions as we vary the parameters? Specifically, if we vary: the level of obviousness for the correct decision; the consensus threshold; and the group size.
To that end, I averaged the outcomes from 150 identical simulations for every combination of each of the following parameters:
Consensus threshold from {33%, 36%, 39% … 96%, 99%}
Group size from {1, 2, 3, … 39, 40}
Obviousness (p) from {10%, 20%, 30% … 80%, 90%}
make_M_draws_of_size_N <- function(num_draws, num_individuals_per_draw, consensus_threshold, probability_correct_choice,
                                   residual_probability_status_quo){
  running_sum <- 0
  for(i in 1:num_draws){
    running_sum <- running_sum + draw_from_sample_sized_N(num_individuals_per_draw, consensus_threshold, probability_correct_choice, residual_probability_status_quo)
  }
  avg_outcome <- running_sum / num_draws
  return(avg_outcome)
}

range_consensus_probabilities <- seq(1/3, .99, .03)
range_num_individuals <- seq(1, 40, 1)
obviousness_conditions <- seq(.1, .9, .1)

df_to_test <- data.frame(expand.grid(range_consensus_probabilities, range_num_individuals, obviousness_conditions))
colnames(df_to_test) <- c("consensus_threshold", "group_size", "obviousness")
df_to_test$decision_quality <- NA

for( i in 1:nrow(df_to_test) ){
  df_to_test[i,"decision_quality"] <- make_M_draws_of_size_N(150, df_to_test[i,"group_size"], df_to_test[i,"consensus_threshold"],df_to_test[i,"obviousness"], 2/3)
}
Getting Some Results
Here’s what those average outcomes look like, graphically.
Each of these nine heat maps is for a distinct level of obviousness (labeled at the top). The consensus threshold sits on the horizontal axis, group size on the vertical axis. Blue scores are better and orange scores are worse.
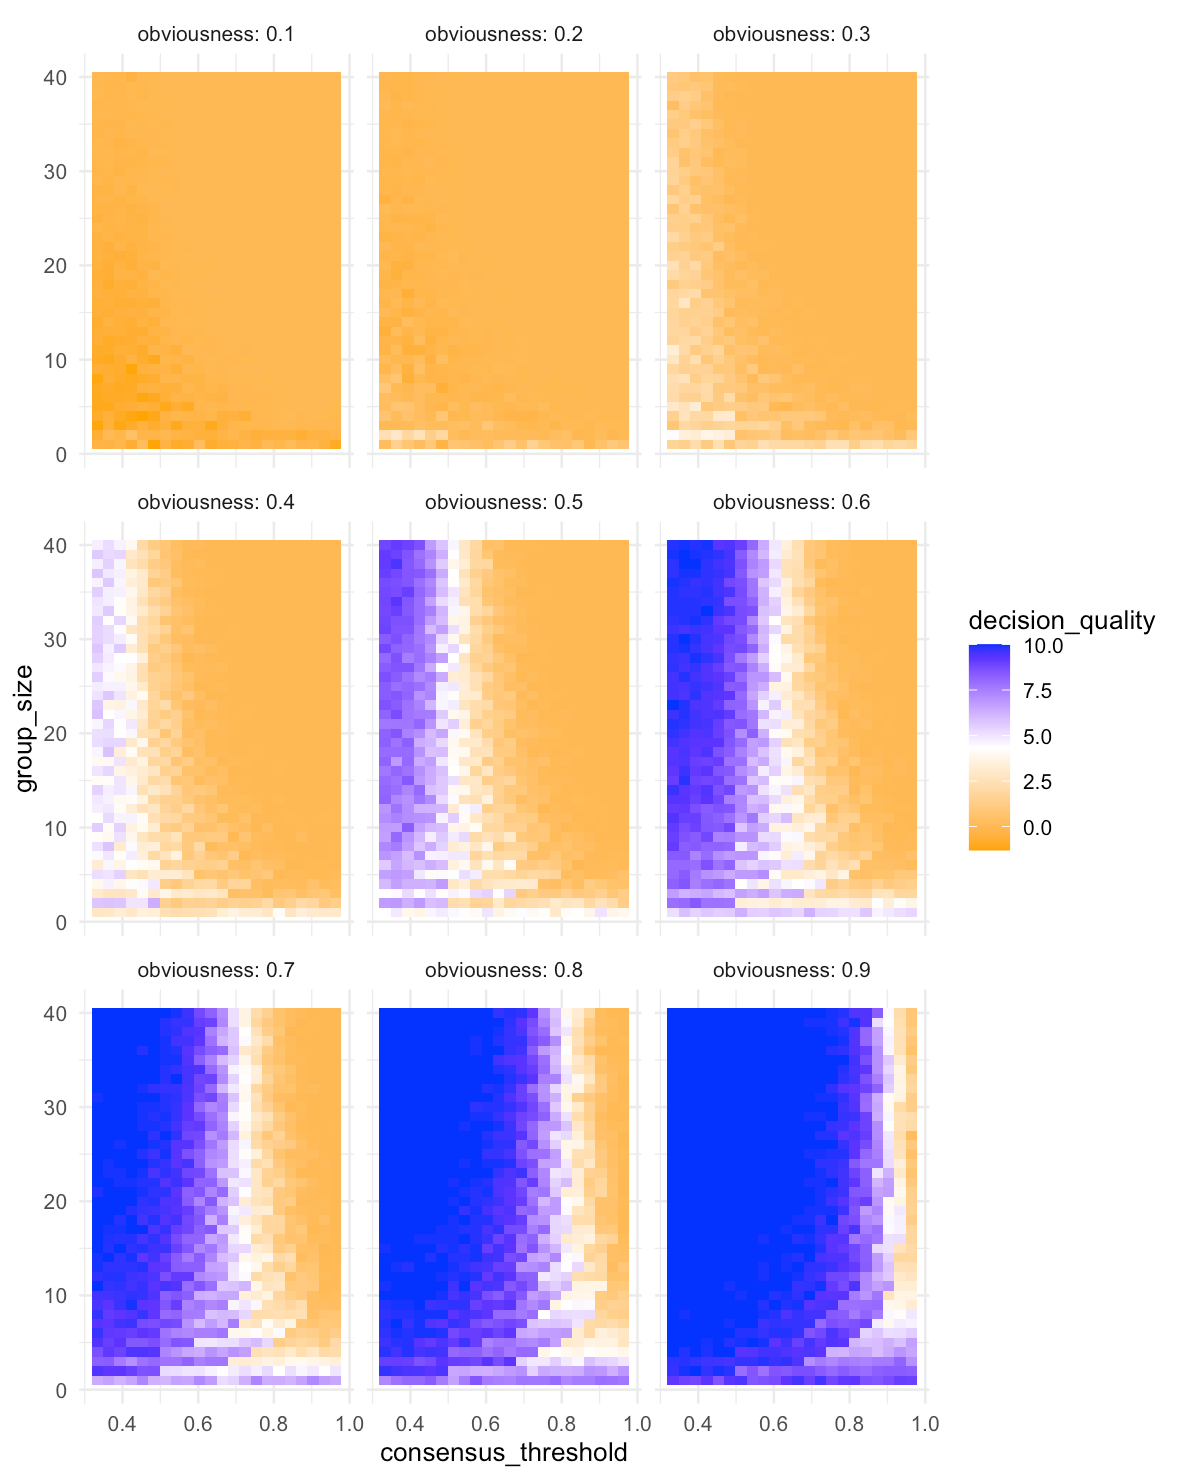
Some observations here:
When the correct decision is not obvious, the small groups unburdened by consensus-based decision making fare the best. But perhaps more interesting to me, the large groups still did pretty well — at least at low consensus thresholds. (See the top right heat map as an example).
As the correct decision becomes more obvious, the larger groups fare better than the small ones — but only if they don’t have a high consensus threshold. Let’s consider where obviousness = 0.8 as an example (bottom row, middle). If we just take a vertical cross section somewhere in the middle (i.e. holding all else constant except group size), we see the larger groups are getting higher scores!