

Net retention convexity in SaaS
Introducing a new metric
Introduction
This is a piece related to net retention, one of the core SaaS metrics.
In this post, I assume the reader has limited prior exposure to net retention but is somehow still interested in the metric. As a consequence, this post is probably going to annoy everyone.
I use this piece to motivate a SaaS metric of my own invention, net retention convexity, which I hope fills a void of context in interpreting net retention.
What context do I think is missing from net retention? I frequently hear folks in the industry interpret net retention incorrectly. Sometimes they interpret net retention incorrectly while writing very large checks and without realizing that they’re making a mistake. I hope we can all agree that this is suboptimal.
The most common error is to project trailing net retention as the underpinning for some forward-looking statement. For example, you’ll most commonly hear someone say “This business has 141% net retention. That means if they didn’t acquire any new customers, they’d still grow topline by 41%.” This result does not logically follow, and it is frequently incorrect in practice.
So why is this interpretation incorrect? Because it ignores two important details — first, the representative expansion path of a customer cohort; and second, the changing cohort composition of the business over time. Retention convexity helps check these dynamics.
I’ll get into (a lot) more detail by what I mean.
What is net retention?
To start, we have to ground ourselves in the logic of recurring revenue streams.
Introducing gross retention
Let’s start with a very simple subscription model: Disney Plus. For $8 per month, I get full access to all Disney Plus content. I’m free at any time to discontinue use of the service, at which time Disney stops charging me $8/mo. Pretty simple.
It should be obvious that Disney wants me to use the service for a long time. If I use Disney Plus for 1 month, I pay them just $8. If I use the service for 10 months, I pay them $80. If they can keep me happy forever, I’ll continue paying them forever.
So we can imagine Disney is interested in measuring churn and mapping customer survival curves.
For example, assume a Disney Customer costs $100 to acquire. If acquired customers churn at 10% per month, then customer lifetimes average 10 months and receipts total $80; at 10% churn, Disney would be losing money on a unit basis.
At 5% churn, though, customer lifetimes average 20 months and receipts total $160. In this case, the business has profitable unit economics.
We can introduce gross retention as just the difference between 100% and churn. The importance of gross retention extends from the importance of churn.
Introducing net retention
In recurring revenue businesses, it’s common for customers to pay more over time; this is typical of enterprise software in particular. Even if you churn out some customers, you often recoup your losses by upselling the customers you keep. As a result, gross retention is inadequate on its own, and we have to track net retention.
In this case, let’s just imagine a very simple business gets started. They offer two packages to customers: a basic package that costs $10/month and another premium package that costs $20/month. Now imagine further that they’re open for just a single day. During this time, they acquire a single batch, or cohort, of 10 customers. All these customers start on the basic plan.
To recap, on day 0, the company has 10 customers paying $10/month. That’s $100 of aggregate monthly recurring revenue (MRR) on day 0.
To gauge retention, we’ll typically compare that same group of 10 customers a year after acquisition. We take the sum of their revenue after 12 months and divide it by their day 0 revenue.
Here are a few example scenarios:
If the business churns out 3 customers and upsells none:
Month 12 revenue: $70 MRR
Day 0 revenue: $100 MRR
Implied net retention: 70%
If the business churns out 3 customers, but upsells 3 others to the advanced plan:
Month 12 revenue: $100 MRR (3 * $0 + 3 * $20 + 4 * $10)
Day 0 revenue: $100 MRR
Implied net retention: 100%
If the business churns out 3 customers, but upsells 5 others to the advanced plan:
Month 12 revenue: $120 MRR (3 * $0 + 5 * $20 + 2 * $10)
Day 0 revenue: $100 MRR
Implied net retention: 120%
Two distinct approaches to retention
Okay, after that long-winded exposition, I’m finally getting to the point (I promise.)
You might have noticed a quirk in the scenario I used to introduce net retention: that the company only ever acquired one batch, or cohort, of customers.
Acquiring only one cohort of customers is probably not a sign of a viable business; we have to be prepared for more complexity than that. As it turns out, once we’re dealing with multiple cohorts, we’re forced to choose how we calculate net retention.
In general, there are two ways to approach net retention. To my knowledge, no consensus terminology exists to distinguish these, so I’ll just describe them as I do with peers.
I’ll call the first approach “point in time net retention.” And I’ll call the second approach “cohorted net retention.”
Point in time net retention
Point in time net retention is the more common metric that you’ll see thrown around in board meetings and quarterly earnings reports. Calculating point in time net retention is usually extremely simple. It usually goes something like this:
Pick a reference date. In this case, we’ll say June 1st, 2022.
Based on your reference date, pick a look-back date exactly one year prior. Because we’re looking back from June 1st, 2022, our look-back date is June 1st, 2021.
Identify all customers who paid you anything in recurring revenue on the look-back date, June 1st, 2021.
Among all the customers we identified in step 3, sum up their recurring revenue as of the look-back date, June 1st, 2021. This is our denominator. Let’s imagine for simplicity that all of those customers had aggregate recurring revenue of $100 on our look-back date (the absolute value of this number is not important).
Again, among all the customers we identified in step 3, sum up their recurring revenue as of our reference date, June 1st, 2022. This is our numerator. Let’s call this number $X.
Our net retention is then simply $X / $100, or X%
If X > $100, then we’ve upsold more dollars than we’ve churned
If X = $100, then we’ve upsold exactly as many dollars as we’ve churned
If X < $100, then we’ve upsold fewer dollars than we’ve churned
Although this will seem complex if you’ve never dealt with net retention before, it’s quite an easy analysis.
To see how a simple metric like this becomes complicated, you can read footnotes in quarterly earnings — my personal favorites are Toast and Snowflake. Some companies have to worry about edge cases in how recurring revenue is defined or how you uniquely identify customers, among other things, but that’s not really important for these purposes.
Cohorted net retention
There’s an alternative to point-in-time net retention that I strongly prefer.
The approach differs in that the metric is calculated within batches — cohorts — of companies at different maturities.
To skip ahead, cohorted net retention lets me say things like the following:
12 months after customer acquisition, we typically retain 115% of the recurring revenue we had at the time of acquisition, but by 24 months, we’ve typically retained just 110%.
‘Saturation’ net retention usually happens at 175% of recurring revenue at the time of acquisition, and we usually approach this point within 24-28 months.
The customers we acquired in Q4 churned at a much higher rate than the customers we acquired in Q3
I’d argue that these data points are very helpful for understanding the health of your business!
However, the calculation is much more involved. In reality, some SaaS investors (who should be calculating like-for-like net retention as part of any diligence process) and many management teams do not know how to do this.
The calculation typically goes something like this:
Group every customer you’ve ever had by their date of customer acquisition — these are your cohorts. It’s conventional to group them by the acquisition month. But there’s really no reason you couldn’t do something else, say, weeks or fiscal quarters.
(Optional, but prudent) Group every customer you’ve ever had by an additional layer of segmentation, e.g. end market vertical, use case, company size.
Within each cohort, do the following (you should end up with the data you need to create a chart like the one in Figure 1):
Sum up all recurring revenue at the time of customer acquisition
Sum up all recurring revenue at each interval of time elapsed since acquisition
Scale all recurring revenue at each interval of time elapsed as a proportion of revenue at the time of customer acquisition

Figure 1: you should be able to get a chart like this! (These are extremely fake numbers I just made up, to be clear.)
Now for certain audiences removed from the details, it’s sometimes of interest to distill these cohorts’ net retention time series into a single metric. There’s no settled way to do this, but I tend to do the following:
Consider the most recent 6 cohorts for which 12 months of data exist
Of those 6 cohorts, take either the median or a revenue-weighted average of their net retention 12 months after customer acquisition

So this one is a little complicated! You might be thinking, “This cohorted thing seems unnecessary, confusing, and weird. I’d rather just use the point-in-time approach.”
Now we get to the point of the post, I promise. The simplicity of point-in-time net retention is exactly the problem; the simplicity comes from a choiceful ignorance of cohort composition effects. Unless you’ve done the work to confirm that cohort composition effects don’t matter, this can be a huge problem.
A big problem with point-in-time net retention
Representative expansion paths
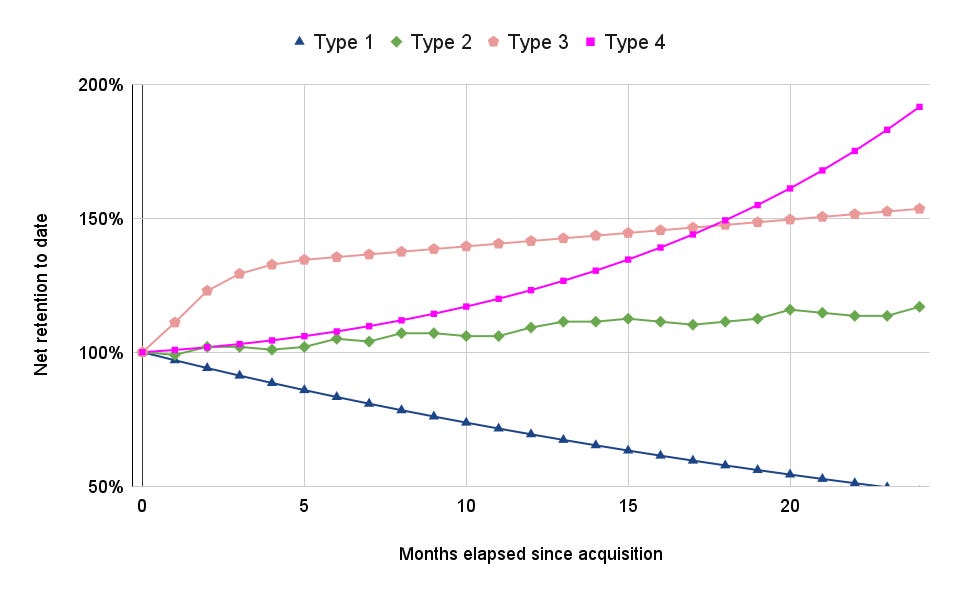
Let’s start by assuming every customer of a particular expands in the same way — effectively averaging any heterogeneous behavior. This gives us our starting point, a representative expansion path. This looks something like the below in Figure 2, where we think about the average path of a customer for a made-up company. You’ll probably notice that this is the company-level analogue of our cohorted net retention curves.

It’s extremely important to realize that the shape of these curves will vary across companies, most commonly as a consequence of a company’s monetization strategy.
This is easiest to understand through examples. I’ll suggest four general archetypes and discuss why they might have some different shapes. To be clear, these archetypes are neither mutually exclusive, collectively exhaustive, nor particularly empirical; they’re merely illustrative. (For the uninitiated, ‘illustrative’ is how a consultant politely admits he’s made something up).
Type 1, a representative consumer/prosumer SaaS. The target customer churns at high rates month-over-month and therefore has short customer lifetimes. It’s rare to have a consumer SaaS that can meaningfully expand the value of any given customer. So you’re left with something that looks like a a decay curve.
Type 2, an enterprise SaaS that prices on a flow variable. There’s a lot of noise to the curve, because customers’ usage patterns are unstable over time. What could this be in practice? Maybe you sell an invoicing and collections software, and you only charge your customers a flat fee for every bill they send to customers. This can be lumpy behavior. But all the same, your customers are generally growing, and so you get a generally upward slope.
Type 3, an enterprise SaaS that prices based on a bounded-from-above stock variable — by this I mean some characteristic of a customer that approaches a steady state value over time. Most commonly, this happens when you charge on a seat-per-user basis. For instance, if I sell an IDE for my customers’ developers by charging per developer, the amount of money I collect is limited by the number of developers my customers have. And this number can’t really grow in perpetuity.
Type 4, an enterprise SaaS that prices against a stock variable for which input flows increase monotonically. In practice, this is frequently based on the volume of data or storage that a customer has. Even if a business stagnates, its pile of data continues to grow at an accelerated rate. These kinds of monetization strategies can lead to an exponential expansion path that underwhelms in the short run but, with continually compounding behavior, has the greatest long-term opportunity (at least from a net retention perspective).
Point-in-time retention in the time series: Type 3
What’s really interesting is the behavior of a company’s point in time net retention as it matures. Perhaps unsurprisingly, this depends on the representative expansion path.
Let’s imagine a company that behaves like this:
The company acquires exactly 1 new customer every month.
Every customer is identically worth $100 in recurring revenue in their first month
Every customer expands identically according to an expansion curve of Type 3
It’s very easy now to model this business in aggregate; I’ve included a cohorted breakdown in Table 1 here.

Before moving to more important observations, I want to reiterate: the pace of customer acquisition is constant, and every customer is exactly the same. In other words, the product-customer level performance of the company remains entirely unchanged. And yet, the point-in-time net retention metric collapses as in Figure 4.
Why? Each cohort becomes slightly older from one month to the next, so the average age of a dollar of recurring revenue increases. And because we set this example up as a Type 3 expansion path, we know older cohorts are going to expand relatively less than newer ones. As a consequence, when the company’s weighted average cohort age increases, its net retention must decrease.

Brining it back to the beginning briefly :p
At this point, it’s helpful to return to the beginning of the post. I’ll often hear investors repeat some version of, “This business has 141% net retention. That means if they didn’t acquire any new customers, they’d still grow topline by 41%.” Lots of really smart people stubbornly believe this is true.
Except we’ve just shown this conclusion is wrong; if we’d caught our investor friend making this claim at month 12, he’d be very wrong. At month 12, trailing net retention is 141%; looking ahead to month 24, we see trailing net retention is 113%. The business would have grown by just 13% if relying solely on expansions.
Point-in-time retention in the time series: Type 4
One might find himself tempted to claim net retention just decreases as customer cohorts age. This could be true empirically — I truthfully have no idea — but a simple counterexample will suffice to demonstrate it’s not necessarily true.
Below, I simply repeat our cohorted retention exercise for a Type 4 expansion path.
The company acquires exactly 1 new customer every month.
Every customer is identically worth $100 in recurring revenue in their first month
Every customer expands identically according to an expansion curve of Type 4
It’s easy to see that the net retention time series curve actually slopes upward. Is the business getting better at retaining customers? No, not at all. Remember, every cohort is identical (just offset one month from the prior cohort).
This is entirely an artifact of the weighted average cohort age increasing over time. For the Type 4 expansion path, customer-level recurring revenue grows exponentially, and so customer cohorts grow more quickly as they get more mature.


Why does this matter? What do we do with this?
I hope it’s clear that point-in-time net retention is a dangerous metric on its own— at least in the time series. Here are two major reasons it’s dangerous:
It’s impossible to draw high-fidelity operational insights from a point-in-time net retention time series. For example, if you see a +500bp lift in net retention, there’s no way to know if you’re actually doing a better job of expanding customers. Marginally faster or slower new logo acquisition could easily effect a phantom trend.
Point-in-time net retention is not actually that comparable across businesses. In spite of all the benchmarking that undergirds early stage SaaS investing, small differences in net retention mean very little without cohort context. All else equal, I’d vastly prefer a 110% point-in-time net retention in a Type 4 curve business than a 115% point-in-time net retention in a Type 3 business. Why? In the long run, comparable cohorts in the Type 4 business will overtake their counterparts in the Type 3 business.
Point-in-time net retention will probably ruin a strategic plan. Unless you’re very lucky, you should expect that any forecast based on point-in-time net retention suffers from cohort composition effects. Practically speaking, this is one of the sneakiest ways that revenue targets will elude GTM teams (e.g. if you expect 30% of your number to come from expansions, and then you only get 15%, you’re in bad shape).
In my mind, there are two broad approaches that could be helpful for resolving the problems with point-in-time net retention.
Cohort everything. If I had it my way, everyone would forecast and report on their businesses based on acquisition cohorts. Unfortunately, cohort models are laborious to build, painful to maintain, and too challenging to communicate without significant prior context. Maybe Thoma Bravo would salivate at a tidy cohort model, but the median board member might develop a headache.
Supplement point-in-time retention with a pseudo-cohorted metric. This is ultimately the point of this whole post. I’ll go into more detail.
Supplementing point-in-time retention with a pseudo-cohorted metric
Understanding the general shape of a representative expansion curve compensates for most of the problems with point-in-time net retention. Specifically, if I know the convexity of my representative expansion curve, I can hazard a guess at the qualitative impact of aging cohorts on my overall number.
How would you calculate the convexity of this curve? In theory, you’d want to apply a little bit of calculus to a section of the curve. In practice, though, the curve isn’t going to be smooth; it’s likely not even differentiable. You’d have to filter your operating metric through some kind of smoothing process. This just isn’t practical in a world where we can market OLS as artificial intelligence.
So what’s an alternative? Well if we compare the average slope of the curve on two different sections, we can get most of the way there.
I propose defining retention convexity as follows, using the set of cohorts for which 12 months of data exist; for clarity, let’s just define three quantities algebraically:
Let A = Revenue-weighted average cohorted net retention at 12 months
Let B = Revenue-weighted average cohorted net retention at 6 months
Let C = Revenue-weighted average cohorted net retention at acquisition (only this verbose to help illustrate the logic; this number is always just 1 by construction).
Retention convexity = (A-B)-(B-C) = A-2B+C = A-2B+1
In short, what I’m doing here is subtracting the slope of the representative expansion curve’s first half-year from the slope of the second half-year.
If the second half of the curve is steeper than the first half, we get a positive number.
If the second half of the curve is the same as the first half, we get zero.
If the second half of the curve isn’t as steep as the first half, we get a negative number.
We can also distinguish between similar curves using this method. A curve that compounds at 10% will be considered more convex than a curve that compounds at 5%. I put some examples here. Note that retention convexity doesn’t measure the rate of expansion. Curve 0 expands more than Curve 3 but has less convexity; Curve 6 has the highest retention and the highest convexity.

How would you actually use a metric like this?
In my mind, anyone who uses a point-in-time net retention metric should be prepared to discuss the behavior of representative cohorts. In order to do that, I would argue this retention convexity metric does the trick.
Mechanically speaking, I would prefer to think of retention metrics as an ordered pair, e.g. (125% point-in-time net retention, +20 retention convexity). That way, I have a decent intuition for the general behavior of the company’s retention dynamics as I model different retention scenarios.
For retention benchmarking purposes, it would not longer be sufficient to consider comparable businesses of similar scale, but instead one would consider both the scale and the retention convexity.